Introduction to Google Data Studio (Part 4) – Add filters to your Google Data Studio report
Welcome to the fourth part of our series on the basics of Google Data Studio where we will look at how to add filters to your Google Data Studio report.
If you missed the previous parts, you can read them here:
Part 1 – The pros and cons of Google Data Studio
Part 2 – Set up a basic report in Google Data Studio
Part 3 – Format your Google Data Studio reports
Here’s the link to log in, just in case you haven’t bookmarked it yet: Google Data Studio
We’ve previously looked at setting up charts in your reports to track your website or campaign’s performance. But how useful would it be to filter your graphs by campaign, for example?
I find this a very useful feature as it allows you to report on just one campaign or exclude certain campaigns that you know are not relevant to your report. Another common report I use is traffic by Channel.
It’s useful to be able to see what traffic you are getting from Social, for example.
Filters can be added at either report or chart level. I often run reports that show charts for various campaigns, so I usually add my filters at chart level to give me that flexibility.
If you only want to report on a specific campaign, channel or other dimension, you should look at adding it at report level.
Add filters to your Google Data Studio report
Let’s look at adding a filter to a chart to show website users acquired from social only.
Click on the graph you want to add the filter to. In the properties column on the right side of the window, scroll down to the filter section in the data tab and click “Add a filter”.
At the bottom of the column, you will now see a link to “Create a new filter”. Click this and you will see the following screen:
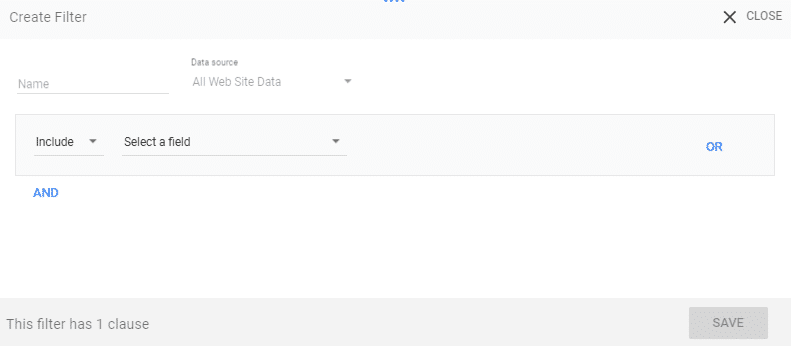
In the name field, give your filter a name that is meaningful to you. This filter will be available to you again throughout the report so if you have several filters set up, it’s useful to know what each of them do.
For this example, I’ve called the filter “Social Only”.
The next field is your data source. This can’t be changed at filter level as it pulls directly from the chart data source.
If your chart isn’t giving you the results you expect, it could be looking at the wrong source so you will need to ensure that your chart is pulling the right data through.
You then set your filter clauses of which you can have multiple. For this example, we will stick to just one clause.
Choose Include or Exclude. For example, in this report we may decide to create a chart that only shows Social, but in the next chart we may want to show everything except social.
For the first scenario, select “Include” and for the second, select “Exclude”.
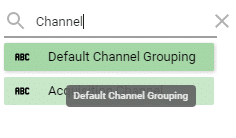
Then you need to select the field that you want to filter on. For this example, we will choose “Default Channel Grouping”.
You can either scroll through the list to find the field you want to use or you can type in the search box at the top of the list.
Once the field is selected, a field to “Select a condition” will appear:
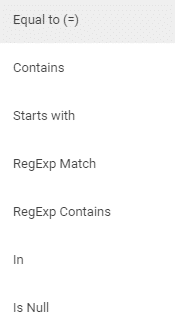
For this report, I’m selecting “Equal to (=)”. Another field then appears where you specify the condition. In this case, I entered “Social”.
On the right hand side of the clause, you will see “OR” and below the clause, “AND”. If you want to include more than one clause, use these options to build your clause as required. Once finished, click “Save” at the bottom right of the window.
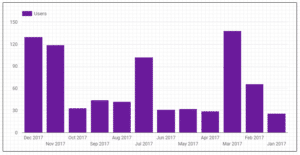
Here’s the change in my charts from “no filter” to the “social only”:
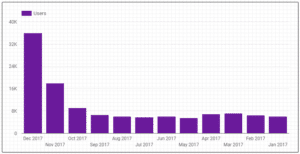
And that’s it! As you can see, it’s really simple to add filters to your Google Data Studio report.
Unless all of your traffic is via Social, you should see a difference between your original chart and the filtered one. If you’re not seeing the results you expect, go back and check that your data source and your clause is set up correctly.
Have a play around with the filters and you’ll be able to create some really useful reports for you/your clients and as we’ve seen in previous parts of this series, they’re quick to update with just a few clicks.
You can read more on filters in the help section of Google Data Studio.
We’ll be back soon with our fifth and final part of this series, where we will look at some of the cool templates we’ve found in Google Data Studio.