Introduction to Google Data Studio (Part 1)
So, you’ve got Google Analytics, Google AdWords, and ECommerce tracking all set up for your amazing website and you’re looking at how everything is performing. Wouldn’t it be helpful if you could pull all this data into one place to use in reports? Well, actually you can! It’s called Google Data Studio.
To get started, go to https://datastudio.google.com and log in with your Google account (the one you use for Google Analytics etc). Once logged in, you’ll see a dashboard:
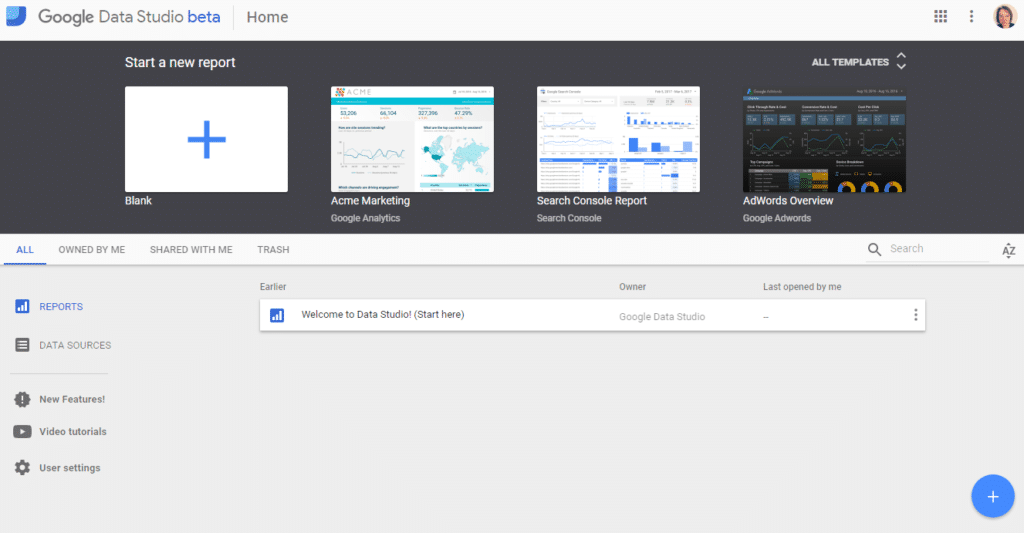
There are lots of sample reports and templates available and I highly recommend viewing the “Welcome to Data Studio (Start here)” report that is listed on the dashboard. It walks you through some of the basic features of Google Data Studio and provides steps on how to set them up.
If anyone has shared a report with you, you’ll see these in the “Shared With Me” tab as well as the “All” tab (the default view).
Pros and Cons of Google Data Studio
As with most things, there are positives and negatives about Google Data Studio. So, before we start looking at how to use the tool, let’s look at a few of the main pros and cons I’ve found.
Pros
- It allows you to bring all your data into one place for reporting and analysis.
- Once a report is set up, you just change the date range when you want to view the latest figures (or historical data). This means that you can see almost live data (as up to date as the previous day’s figures).
- You can share the reports with colleagues or clients with read only access. They can change date ranges or filters to view other data, but the changes don’t save to the master report, so they can’t ruin your lovely report!
- You can build reports with multiple data sources, meaning you can add graphs to your report that show related activities – for example, you can show that an increase in your Google Ads click through rate directly correlates to an increase in eCommerce sales.
Cons
- There is currently no functionality to export the reports to PDF.
- You can import Google My Business (GMB) data but you can’t currently do this natively. You need to export your insights data from GMB in CSV format and then save into Google Sheets. You can then add a Google Sheet as a data source. With GMB being a Google product, this is a huge oversight in my opinion.
Both features have been requested by many users. There are no ETAs on when (or if) these features will be implemented.
In part 2 of this series, we’ll walk you through how to set up a basic report.
Happy reporting!